Dashboard
Dashboard
The Dashboard menu generates useful data for many important management reports that are needed in the hotel business such as revenue report, booking performance, average daily rate, length of stay and so on. These allow the hotel to be able to analyze booking sources and guests’ demography, which are very important for hotel’s marketing strategy.
Performance Analysis
Sales Performance Overview
Shared Revenue Chart
Top 10 Country
Recent Bookings
Channel Status
Performance Analysis
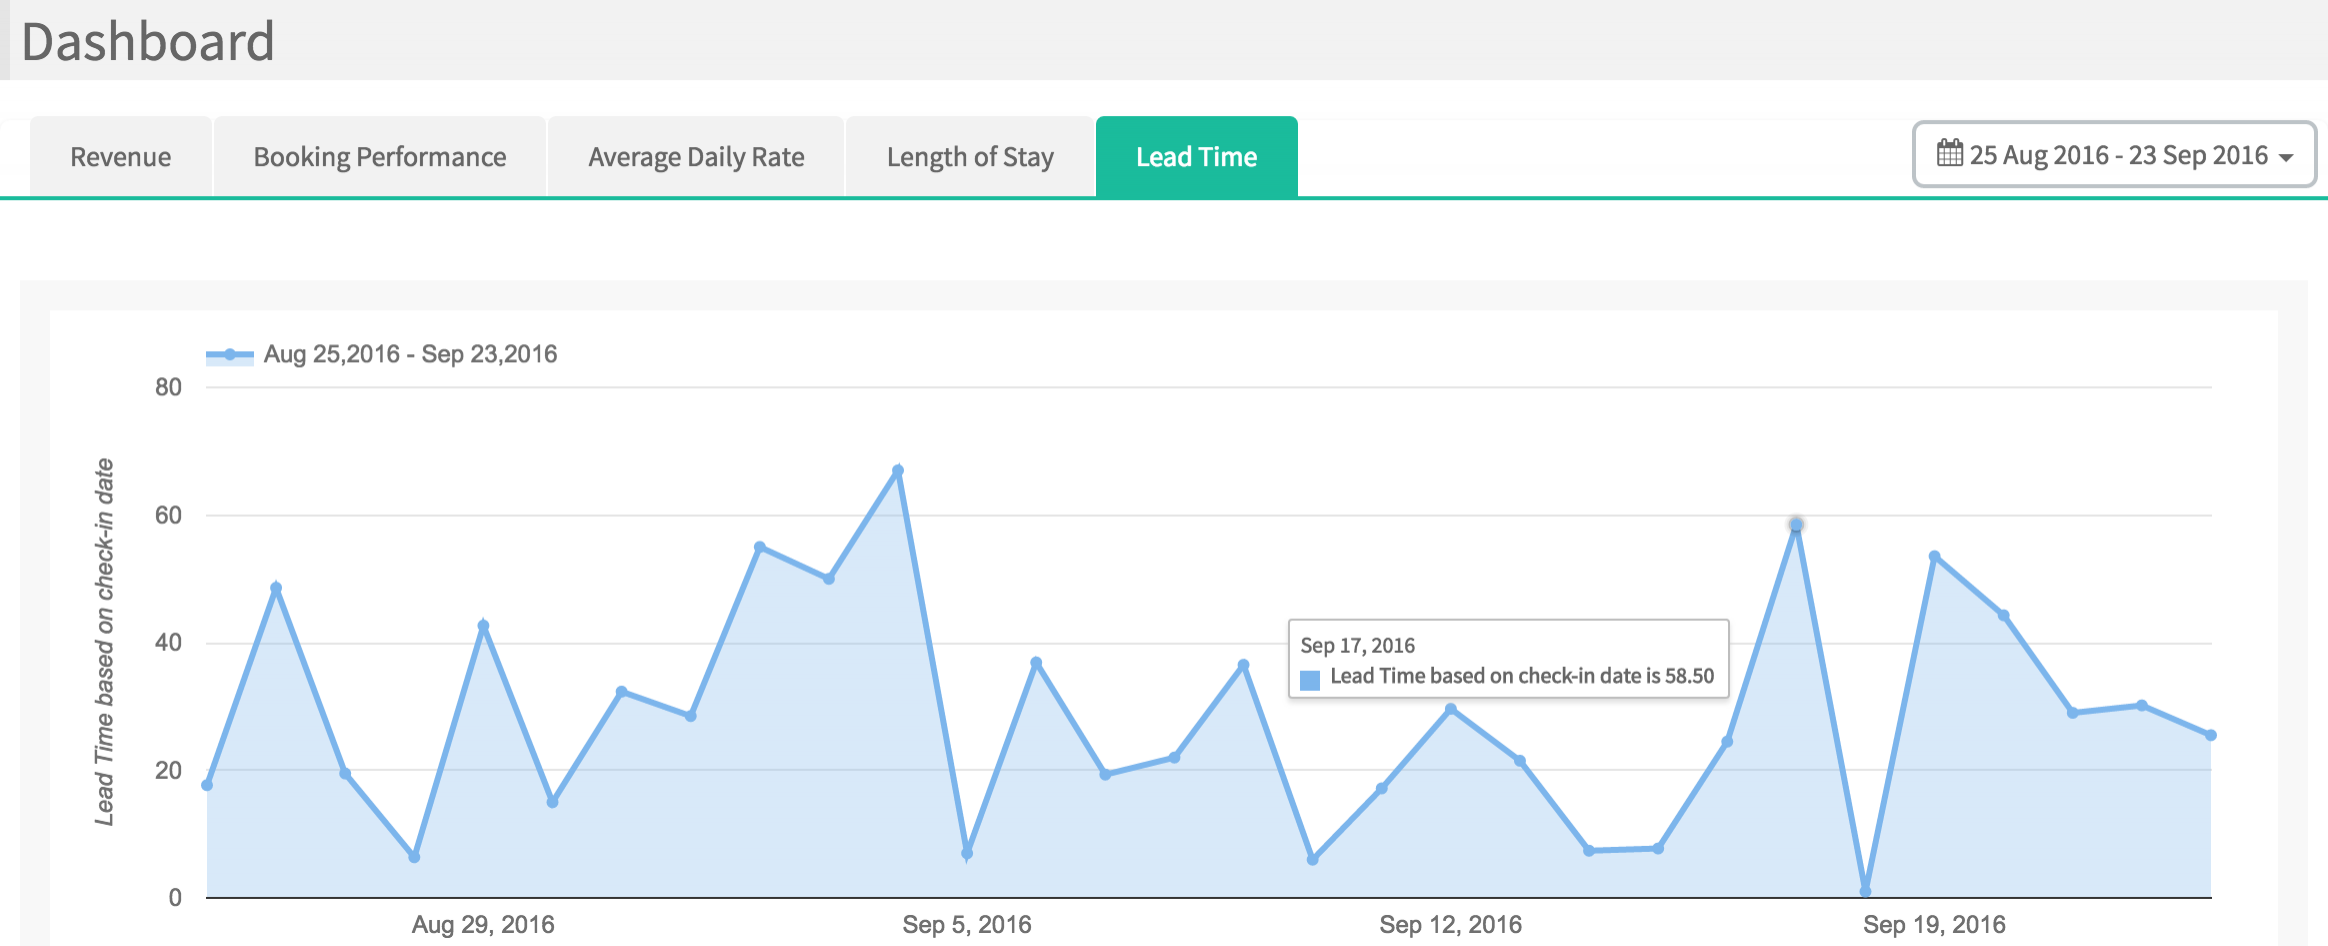
It analyzes different performances in line graphs which are based on created date or check-in date. Follow the steps below to view it.
1) Goto Dashboard menu. The line graph report appears at the top.

2) Select date range to scope the report.
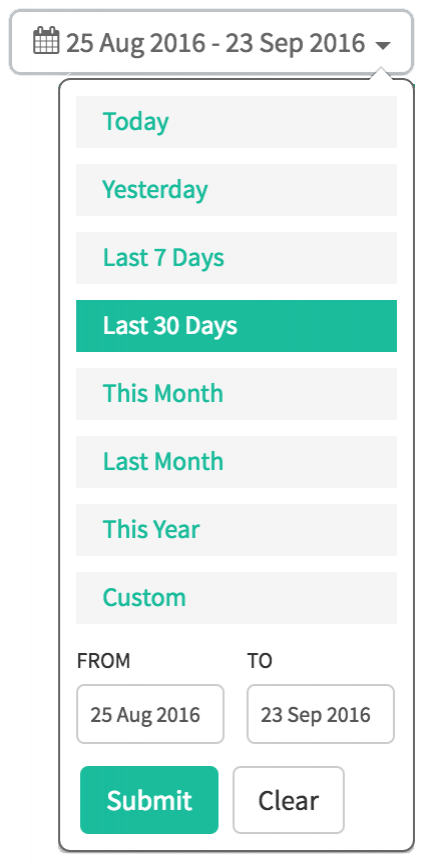
3) Click a report tab you want to view to see details in line graph.
| Revenue |
The total revenue of bookings based on created date.
|
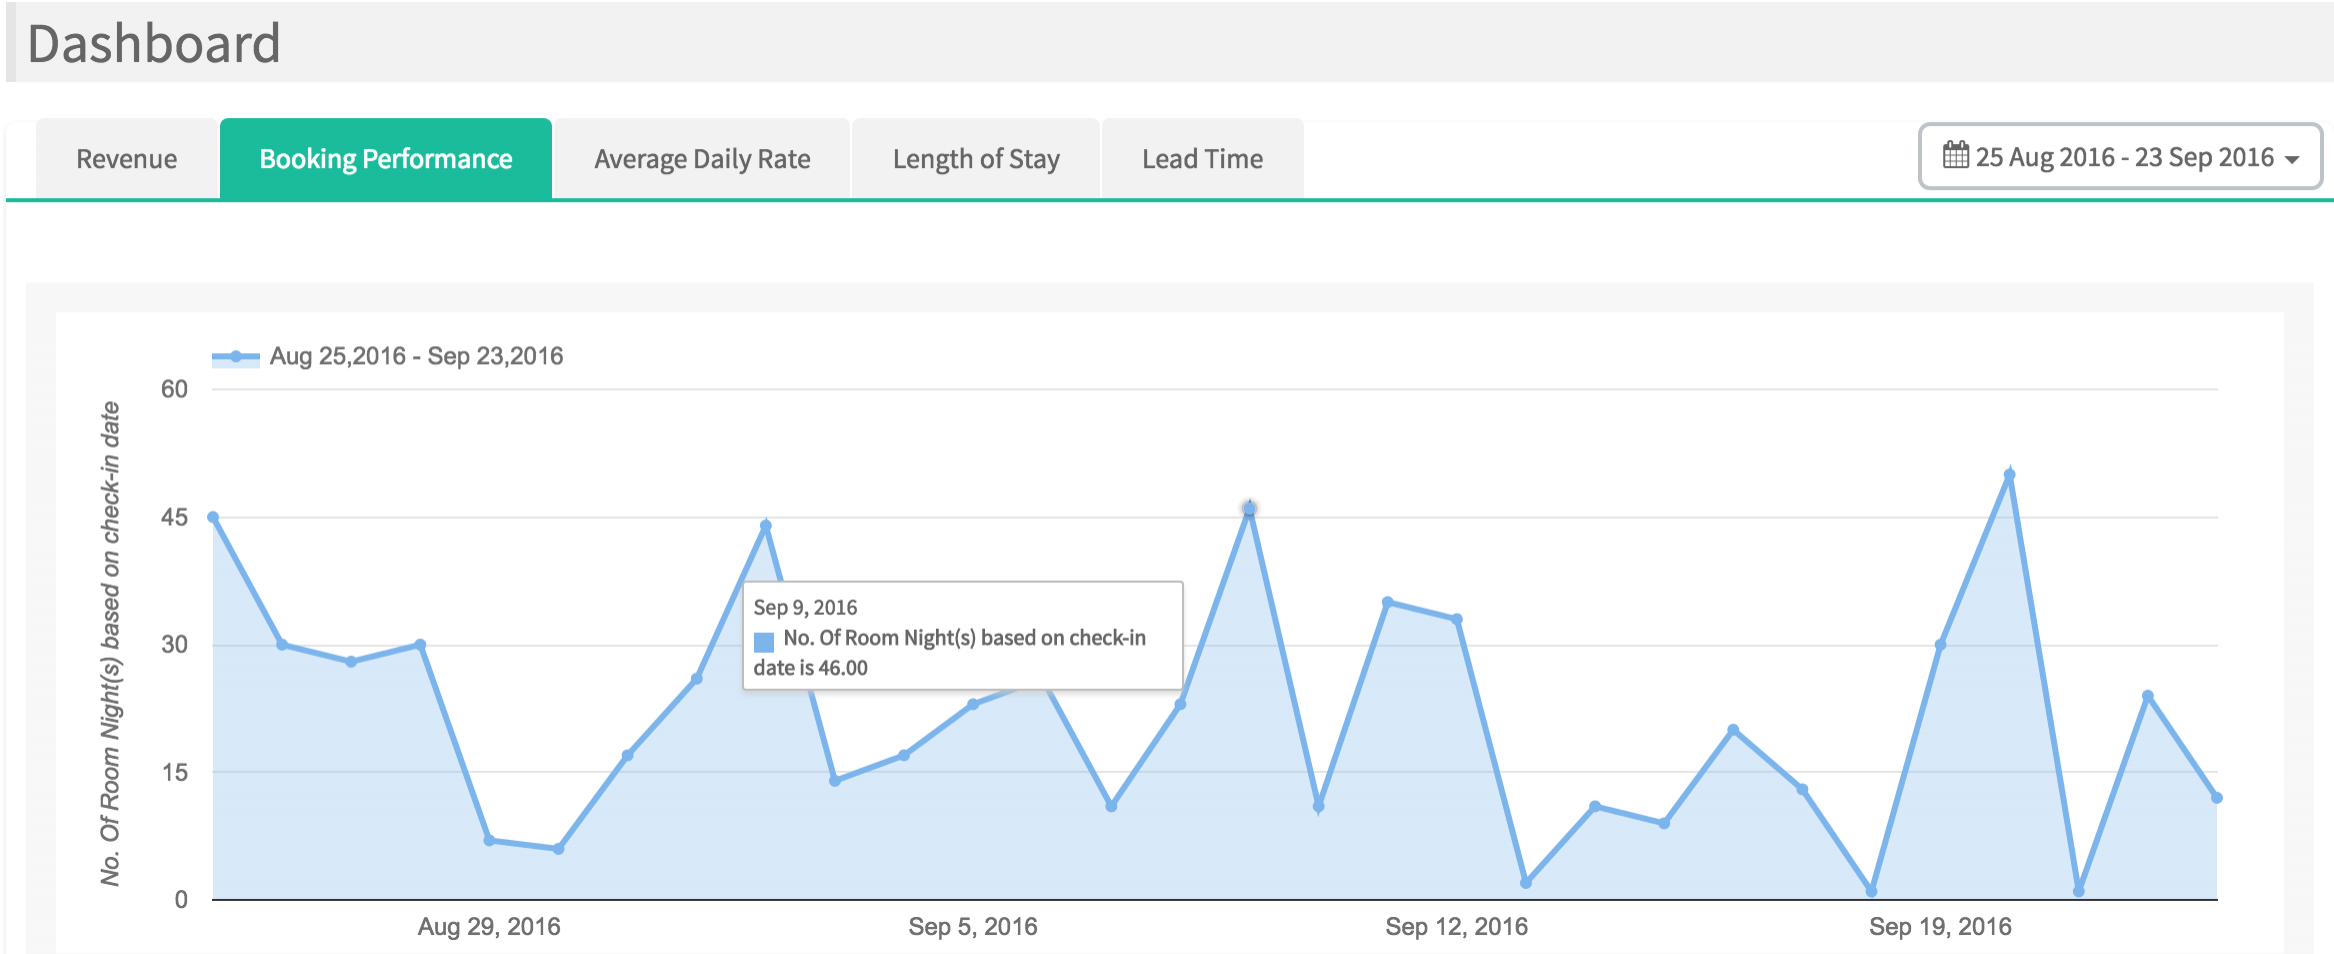
| Booking Performance |
The total number of nights based on check-in date.
|
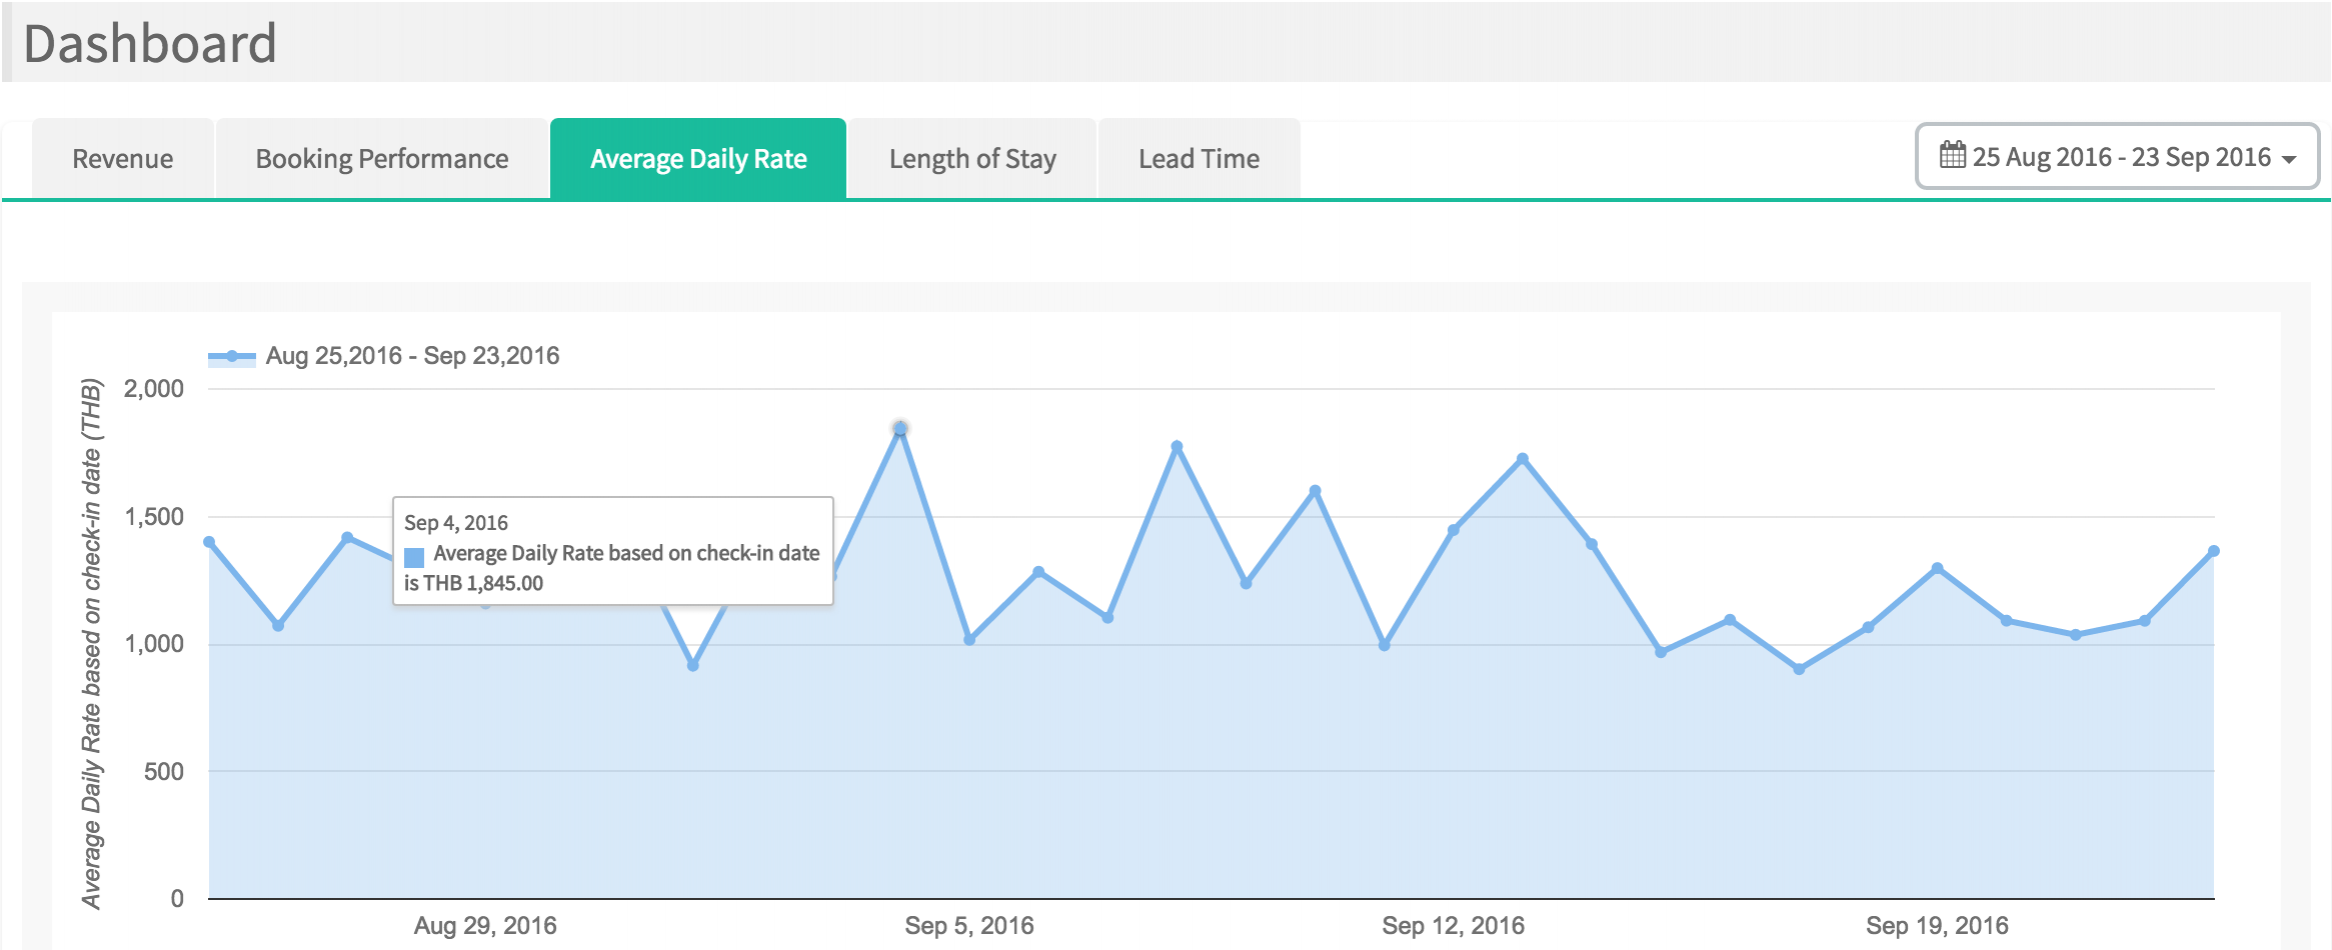
| Average Daily Rate |
The number represents the average rental income per paid occupied room based on check-in date.
|
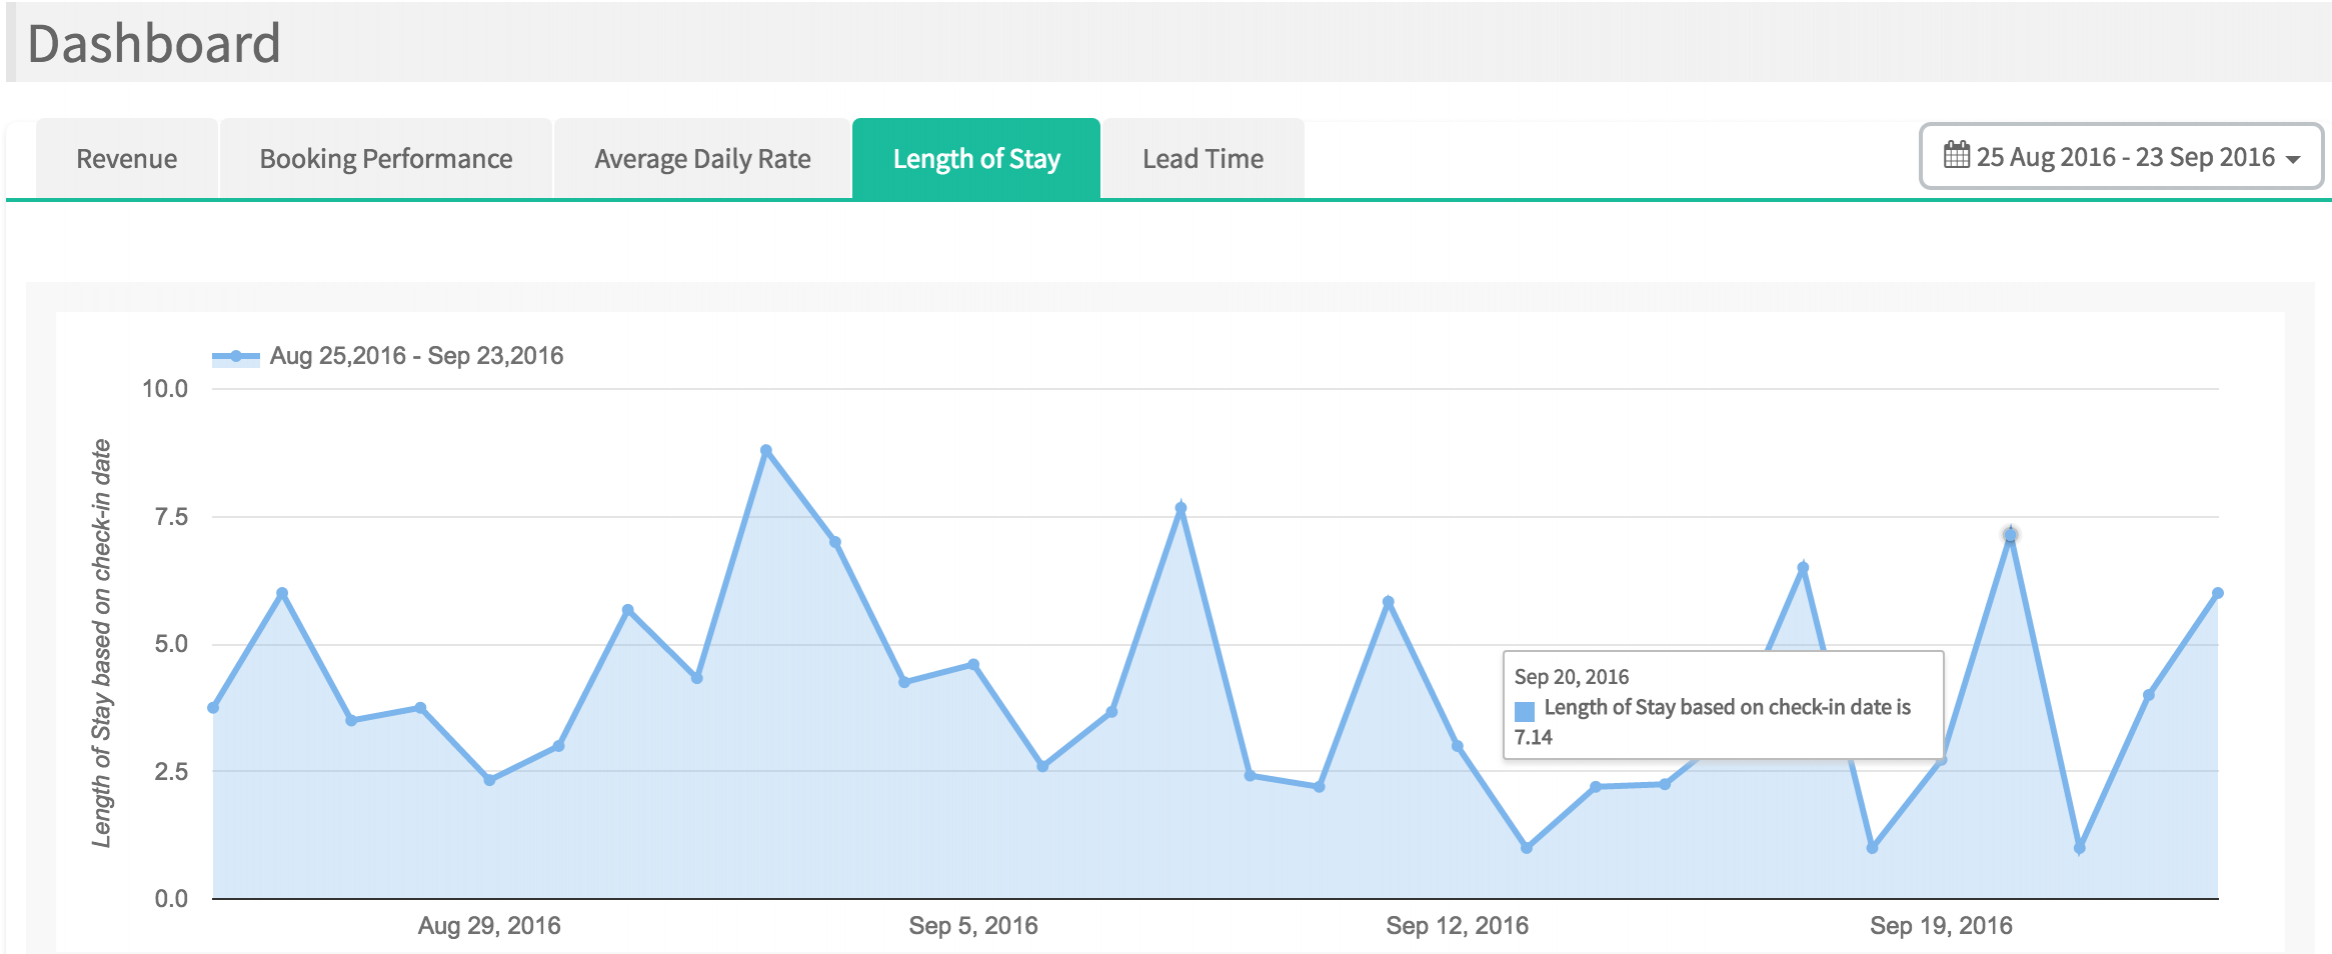
| Length of Stay |
The average number of staying nights per booking based on check-in date.
|
| Lead Time |
The average number of days which are booked in advance based on check-in date.
|
Sales Performance Overview
This report is filtered by the period you select. It represents the overview of Sales Performance which is based on created date only. You can change the period to boundary new performance overview from the top right corner of Performance Analysis.
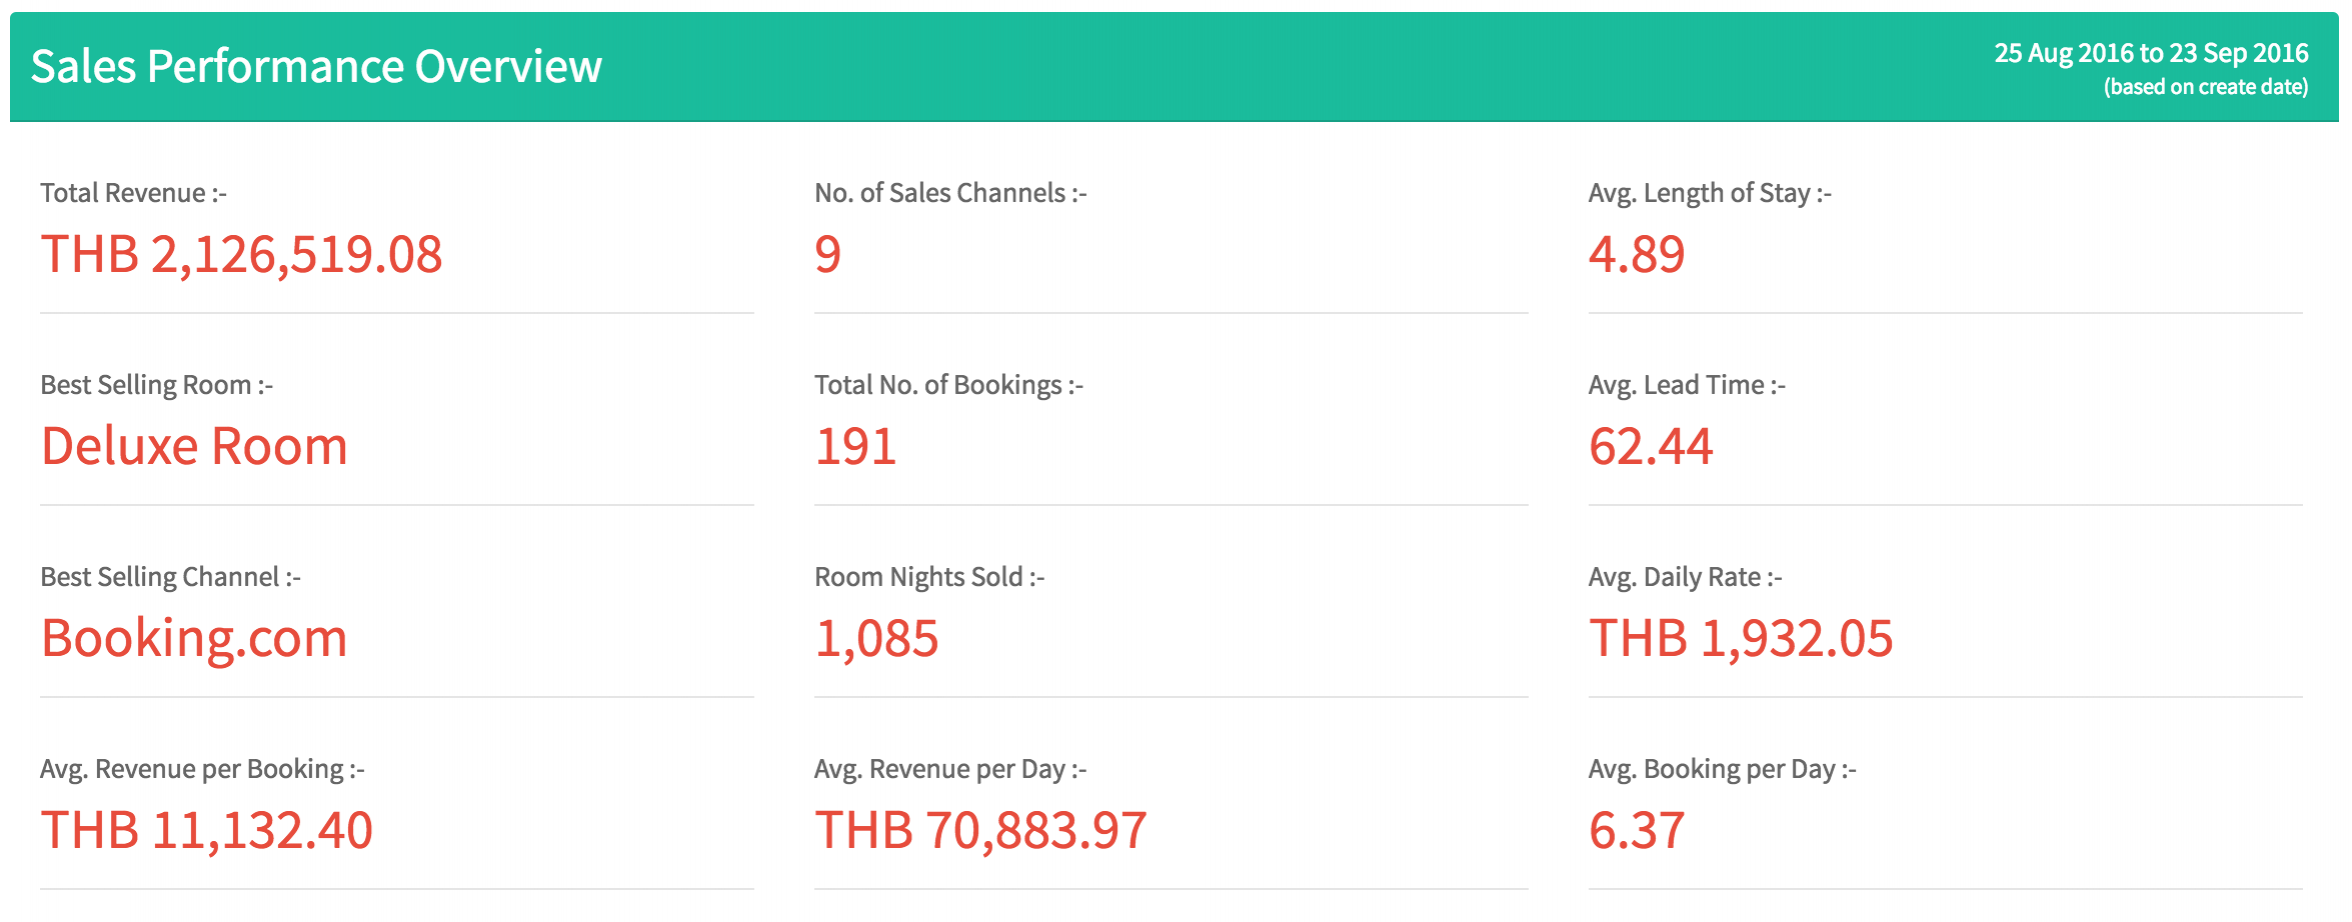
| Total Revenue | Displays total amount of bookings. It is filtered by selected period. |
| Best Selling Room | Displays the best selling room which is filtered by selected period. |
| Best Selling Channel | Displays the best selling channel which is filtered by selected period. |
| No. of Sales Channels | Displays the total number of sales channels from selected period. It is filtered by selected period. |
| Total No. of Bookings | Displays the total number of bookings. It is filtered by selected period. |
| Room Night Sold | Displays the total number of selling room night. It is filtered by selected period. |
| Avg. Length of Stay | Displays the average number of nights during a stay per booking. It is filtered by selected period. |
| Avg. Lead Time | Displays the average number of days that booked in advance. It is filtered by selected period. |
| Avg. Daily Rate | Displays the average rental income per paid occupied room. It is filtered by selected period. |
| Avg. Booking per Day | Displays the average number of bookings per day that booked. It is filtered by selected period. |
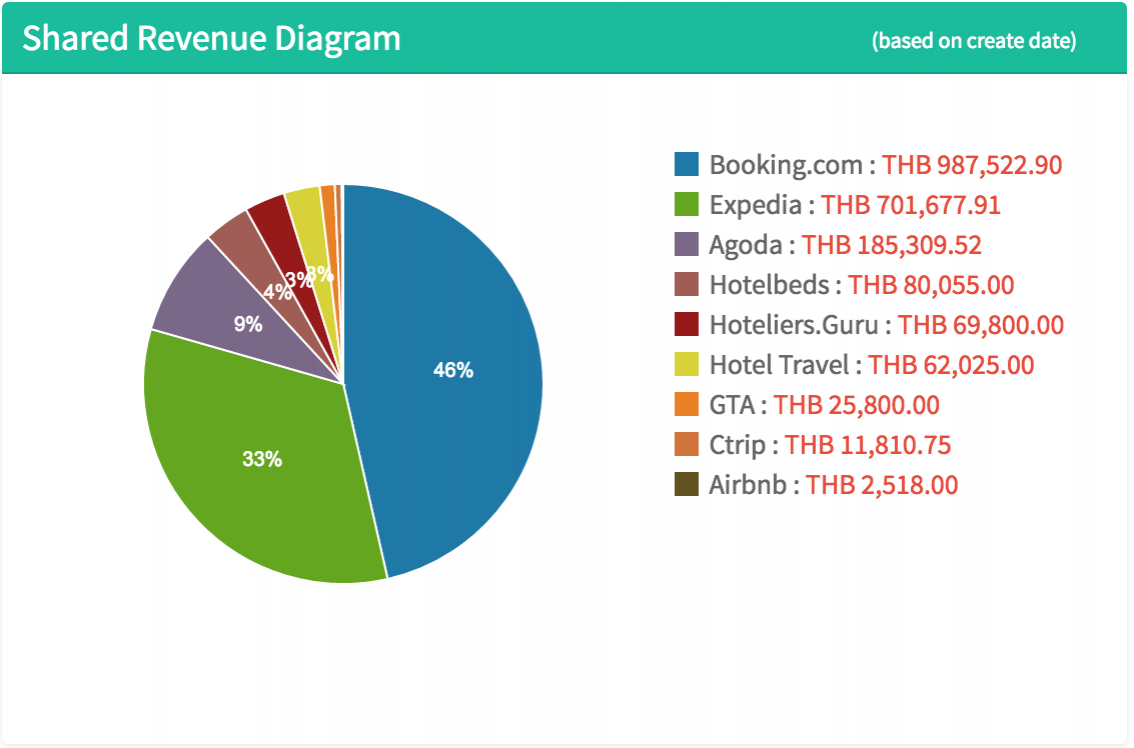
Shared Revenue Chart
This report represents the total revenue of each connected booking channel in Pie Chart. It is filtered by the period you select. You can change the period to boundary new performance overview from the top right corner of Performance Analysis.
Top 10 Country
It analyzes the top 10 lists of nationality which are booked from each booking channel and it is filtered by the period you select. You can change the period to boundary new performance overview from the top right corner of Performance Analysis.

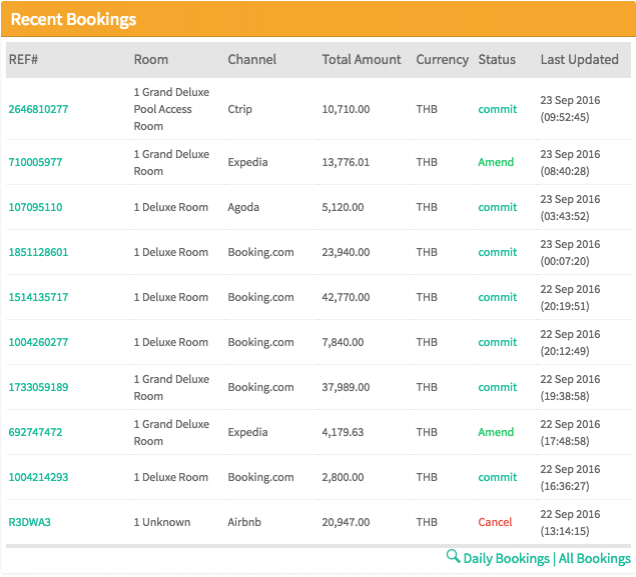
Recent Bookings
It lists all the status of 10 latest bookings which are updated from all connected booking channel. At the bottom, there are shortcuts to link to Daily Bookings (Report > Daily Reservation Report) and All Bookings for easily accessible.
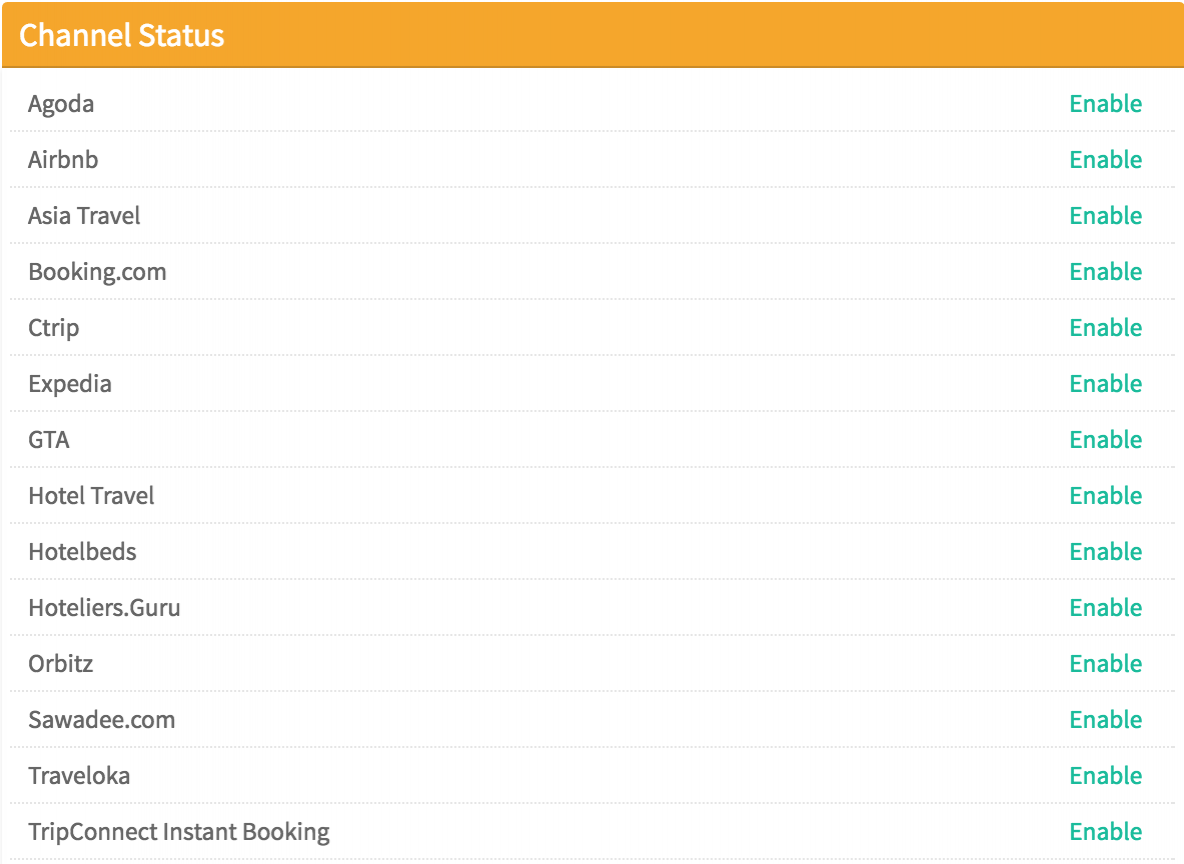
Channel Status
It reports you the status of connection between the channel manager and the booking channels. If you want to change the status, please see Channel > Editing an Existing Channel for more details.
